Case study
ReStock: an order list a shop owner can argue with
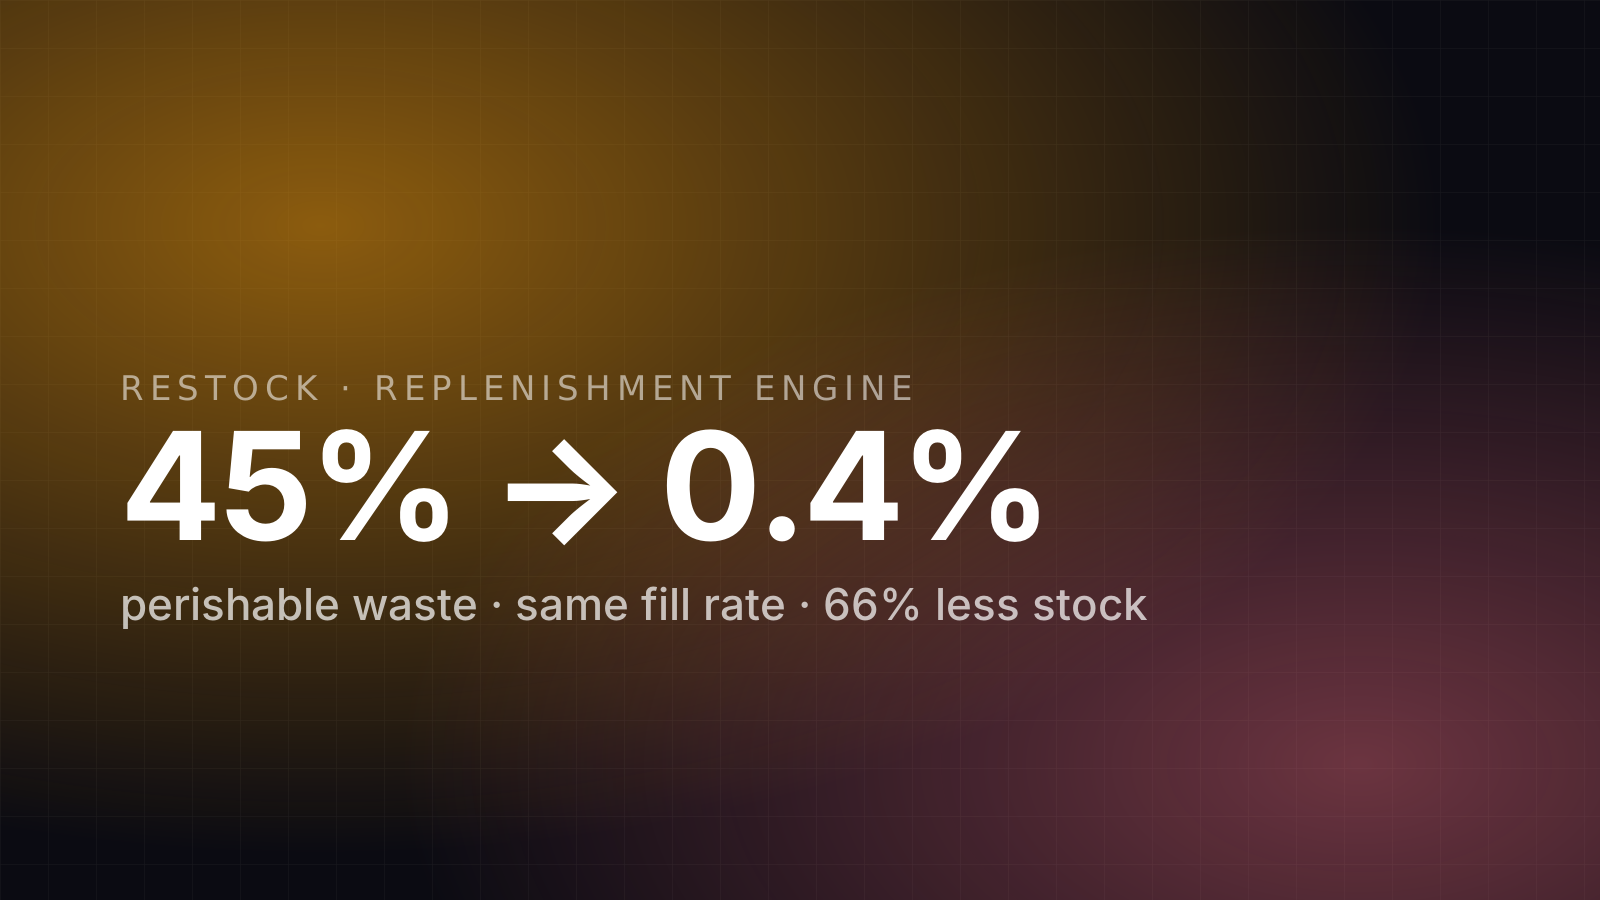
I built an explainable replenishment engine that turns four CSV exports into a daily order list with a reason on every line. On a simulated 120-SKU store it matches the best spreadsheet's 98.1% fill rate with 66% less inventory, cuts perishable waste from 45% to 0.4%, and protects 22% more gross margin under a cash cap.
At a glance
- Role
- Solo: problem framing, decision logic, simulator, evals, UI
- Company
- Independent project
- Timeline
- Oct 2026 · one week
- Team
- Solo (AI-assisted coding)
- 98.1%
- fill rate, equal to min–max, with 66% less inventory
- 45% → 0.4%
- perishable waste as a share of purchases
- +22%
- gross margin under an 80% cash cap vs best baseline
- 23.7%
- 7-day forecast WAPE on holdout (vs 24.8% baseline)
Summary
A kirana or small supermarket reorders several times a week, mostly from memory, and loses money in two directions at once: empty shelves on fast sellers and expired stock behind the counter. I built ReStock, a replenishment engine that takes four CSV exports from billing software and produces a daily order list where every line carries a reason the owner can check with a calculator. Before touching a real store, I built a simulator so every policy could be compared on identical demand. Status: benchmark complete, pilot pending. Source on GitHub.
The problem
A shop with 300–1,500 SKUs reorders 3–7 times a week. Two failures happen together and the owner sees neither as a number: stockouts on fast sellers and waste on perishables.
Spreadsheet min–max rules make it worse in a hidden way. A product that keeps selling out looks like it has low demand, because an empty shelf records zero sales. The rule then orders even less.
User
The owner-operator. They have cash pressure, no analyst, and no ERP. They have exports from billing software and a phone to call suppliers. They will not trust a number they can't check.
Reframing the goal
Every line on the order list carries a short paragraph: recent daily demand, how many days of cover are on hand, the supplier lead time, the case pack, and why the quantity landed where it did.
Options considered
Machine-learned forecasting (gradient boosting, neural nets)
The segment has weeks of noisy data, not years. The models can't be explained to a shop owner, and they overfit the one store you train on. Rejected for a first product.
Auto-ordering: send purchase orders without approval
Removes the most work, but trust has to be earned first. One bad automatic order and the product is uninstalled. Rejected until a pilot proves line-acceptance rates.
POS and ERP integrations
Right eventually, but every integration is weeks of setup per billing vendor. Zero setup is what makes a first pilot possible. Rejected for now.
Explainable rules + a simulator to prove them
Chosen
Censoring-aware smoothing, day-of-week factors, intermittent-demand handling, FEFO for perishables, and greedy margin-ranked cash allocation. Every step is auditable. Validated on a simulator before any pilot.
What I built
1. Demand estimation that handles the messy parts. Censored days (stockouts) are treated as "at least this much", not zero. Weekend peaks and intermittent sellers are handled separately.
2. Order logic the owner can audit. Reorder point and order-up-to level from demand, lead time and a service target, rounded to case packs and supplier minimums. Perishables use first-expiry-first-out so the engine never recommends stock that will expire before it sells.
3. Cash allocation that is greedy on purpose. When the weekly budget can't cover every line, lines are ranked by gross margin protected per rupee spent and filled in order. An optimal solver would do slightly better and be impossible to explain.
4. A store simulator built first. It includes the things that break spreadsheets: empty-shelf days, weekend peaks, promos, perishables with expiry, case packs, supplier minimums and unreliable lead times. Every policy sees identical demand, so the comparison is fair, and nothing is tuned on one shop.
Trade-offs
Results
Simulated 120-SKU store, 5 seeds × 365 days. Three policies on identical demand.
| Gut feel | Min–max spreadsheet | ReStock | |
|---|---|---|---|
| Fill rate | 90.7% | 98.1% | 98.1% |
| Average inventory | ₹19.3L | ₹39.9L | ₹13.6L |
| Perishable waste | 24.2% | 44.7% | 0.4% |
| Gross margin, cash capped at 80% | ₹76.5L | ₹77.3L | ₹94.6L |
Average inventory to hold the same 98.1% fill rate
Perishable waste as a share of purchases
How I measured quality
- 19 hand-checkable unit tests. Every worked example in the logic document is a test with the same numbers, so the documentation can't drift from the code.
- Forecast eval on held-out seeds. 7-day WAPE of 23.7% against 24.8% for a 28-day moving average.
- No tuning on holdout. The smoothing constant was chosen by a sweep on training seeds only.
What I'd do next
Next
Pilot with 3 stores for 4 weeks
Primary metric: % of order lines sent unchanged. Guardrails: stockout days and waste.
Then
WhatsApp delivery
Owners already order from suppliers on WhatsApp. The order list should arrive where the work happens.
Later
Auto-ordering, earned per SKU
Only for SKUs where owners accepted at least 95% of lines for 4 weeks.
What this shows
Problem reframing, decision-making under data scarcity, eval design before launch, and being honest about what a benchmark proves.